Heatwave projections across US cities
Daytime and nighttime heatwave indices under shared socioeconomic pathways
Motivation
Heatwaves are among the deadliest meteorological hazards, with rising frequency and intensity across the United States — from an average of two events per year in the 1960s to six per year in the 2010s. Urban populations carry disproportionate risk because heat exposure compounds with infrastructure stress, intra-urban heat-island variability, and demographic vulnerability. Most prior work focuses on daytime heatwaves in historical periods; nighttime heatwaves and their projection under socioeconomic futures have received much less attention.
Approach
Cities, regions, and time windows
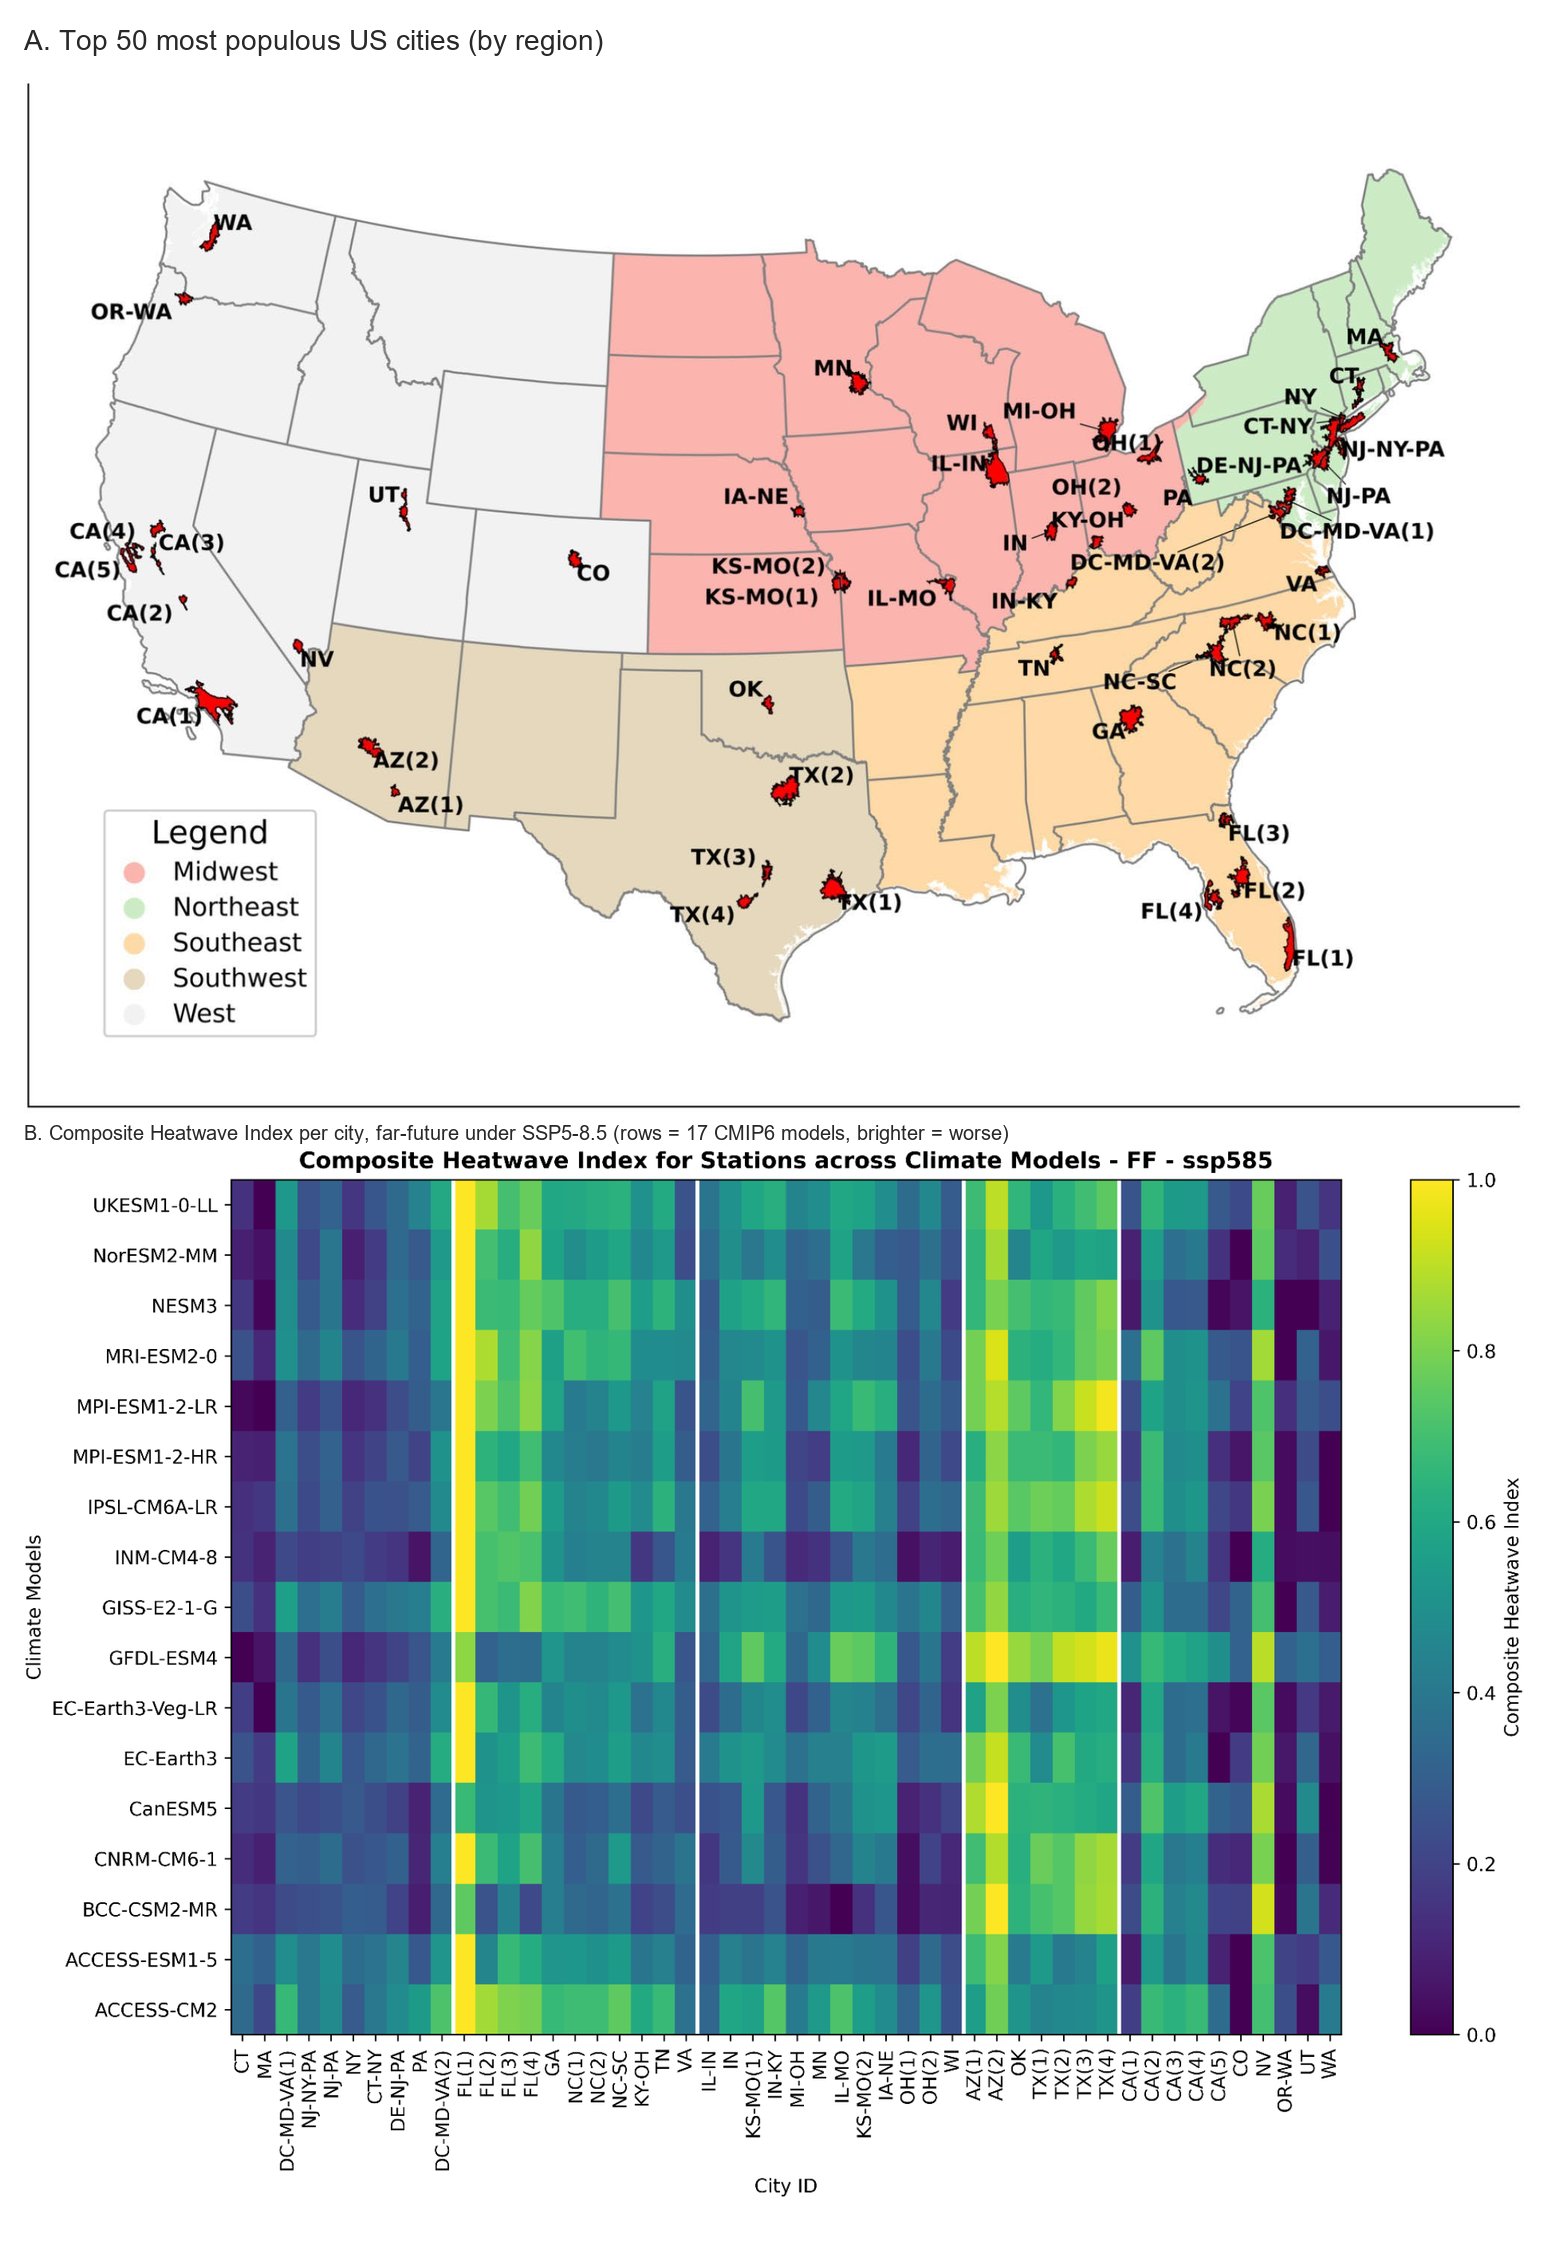
- Top 50 most populous US cities, grouped into five regions (Northeast, Southeast, Midwest, Southwest, West).
- Baseline: 1985–2014. Near future: 2025–2054. Far future: 2065–2094.
- Heatwave defined as 3 or more consecutive days exceeding the 95th-percentile temperature threshold, with thresholds derived from each city’s baseline period and held constant for the future windows.
Daytime and nighttime, treated separately
Two parallel datasets are built from CMIP6 outputs: daily maximum temperature (tasmax) for daytime heatwaves and daily minimum temperature (tasmin) for nighttime heatwaves. Nighttime extremes drive a distinct set of health and energy risks — particularly elevated mortality and air-conditioning demand — that conventional daytime-only studies miss.
Models, scenarios, and validation
- 29 CMIP6 global climate models initially screened; 17 retained after ranking against ERA5 reanalysis on five heatwave indices (number, total duration, longest duration, mean temperature, highest temperature).
- SSP2-4.5 (moderate emissions) and SSP5-8.5 (high emissions) for diverging climate futures.
- ERA5 (~11.13 km) provides the observational backbone for the baseline; comparisons against Meteostat ground-station data via R² quantify the urban-scale fidelity of the reanalysis.
Compound risk via population overlay
1 km gridded population projections (2020–2100) under the five SSPs (Sustainability, Middle of the Road, Regional Rivalry, Inequality, Fossil-fueled Development) are overlaid on the projected heatwave fields, so vulnerability is computed against future demographics rather than today’s.
Bhattarai, Bokati, Sharma, Talchabhadel — Scientific Reports, 2025, Vol. 15, Art. 10643
Key findings
- Significant projected increases in heatwave frequency, intensity, and duration across all U.S. regions, with the most dramatic escalations under high-emission scenarios.
- By the late twenty-first century, cities could experience 2–4× the baseline frequency and duration of heatwave days annually.
- In some regions, projected night-time heatwave durations potentially cover more than half the year.
- Composite heatwave indices flag the most severe heat stresses in southwestern cities (Las Vegas, Yuma) and southern cities (Miami), where climatic and demographic shifts compound.
- The combined climate × demographic framing gives a nuanced read on urban vulnerability that climate-only or population-only studies miss.
Generated outputs
- City-level heatwave indices (HWN, HWTD, HTLD, HWMT, HHT) for 50 US cities under baseline, near-future, and far-future windows for both SSP2-4.5 and SSP5-8.5.
- Climate-model ranking for daytime and nighttime heatwave skill against ERA5.
- Population-weighted exposure surfaces under five SSPs.
Status
Published in Scientific Reports (2025).